
Candlestick patterns forex play a crucial role in trading, offering insights into market sentiment and price movements. By mastering these patterns, traders can enhance their ability to anticipate market shifts. Research indicates that certain candlestick patterns forex can be effective 50-60% of the time when applied correctly. Additionally, studies highlight their value in technical analysis. Strategies outlined in resources like "Profitable Candlestick Trading Strategies" often lead to consistent gains. Whether you're analysing a candlestick chart or refining your trading strategy, understanding candlestick patterns forex can significantly improve your decision-making.
Bullish Candlestick Patterns Forex
Bullish candlestick patterns help traders spot market reversals and upward trends. These patterns show changes in market mood, guiding trading choices. Below are three important bullish candlestick patterns to learn.
Hammer
The hammer pattern uses one candle and appears after a downtrend. It has a tiny body and a long lower shadow, looking like a hammer. This shows sellers pushed prices down, but buyers took control and raised them again. Traders use hammers to find reversals and plan trades.
Studies say the hammer works 50% to 65% of the time. For example, research from 1990-1996 showed a 50-65% success rate. Another study from 2006-2016 found a 63% success rate.
Bullish Engulfing
The bullish engulfing pattern uses two candles. The first is small and bearish, while the second is big and bullish, covering the first. This pattern shows buyers overpowering sellers, often leading to a reversal.
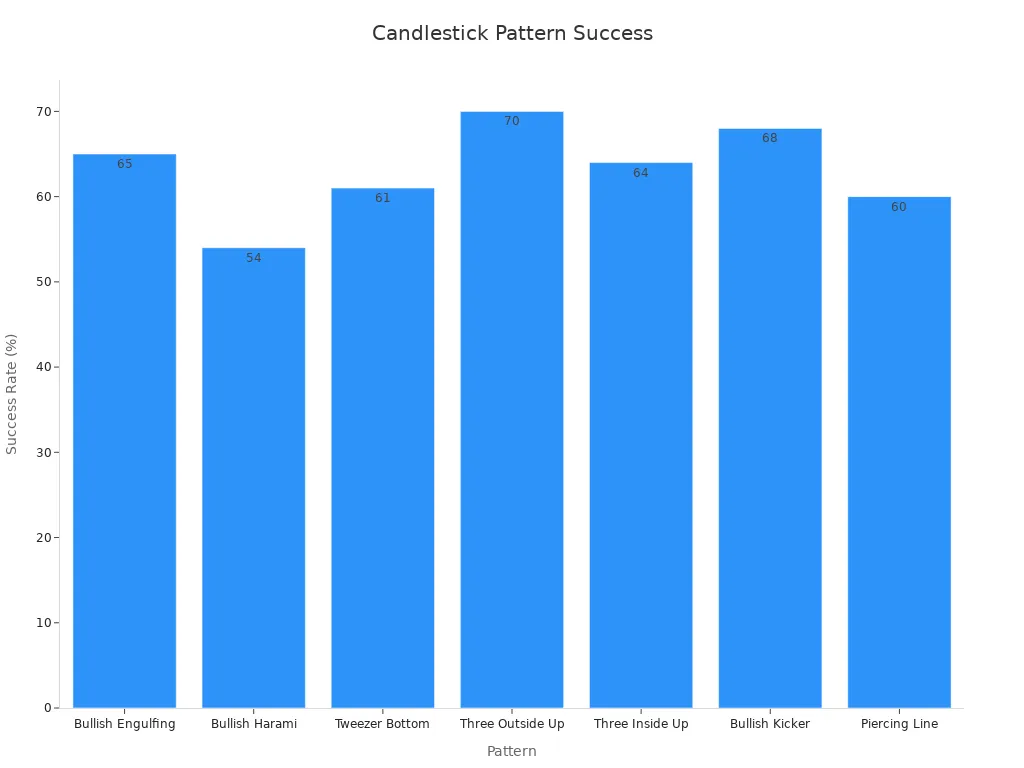
Data says the bullish engulfing pattern succeeds 65% of the time. It is one of the most trusted patterns for spotting upward trends. Below is a chart showing success rates of bullish candlestick patterns:
Morning Star
The morning star pattern uses three candles and signals a reversal from a downtrend to an uptrend. The first candle is bearish, the second is small (showing indecision), and the third is big and bullish. This pattern shows sellers losing control while buyers take over.
Traders trust the morning star because it is reliable. Its shape clearly shows market sentiment changing, helping traders find good entry points.
Learning these bullish candlestick patterns can help you predict reversals and improve trading strategies.
Piercing Line
The Piercing Line is a bullish pattern with two candles. It shows up after a downtrend and hints at an upward move. This pattern signals that buyers are starting to take control.
The first candle is bearish, continuing the downtrend. The second candle is bullish, opening lower but closing above the first candle's middle. This rise shows buyers gaining strength over sellers.
Why Learn the Piercing Line?
- Clear Reversal Signal: It helps spot when a downtrend might end. This can help you decide when to trade.
- Market Sentiment Insight: It shows sellers losing power while buyers take over. This gives a better view of market changes.
- High Reliability: When used with other tools, it often leads to good trades.
Tip: Always check the Piercing Line with tools like moving averages or support levels. This helps avoid wrong signals.
How to Use the Piercing Line in Trading
- Find the pattern after a downtrend.
- Make sure the second candle closes above the first candle's middle.
- Check volume to confirm the reversal's strength.
- Set your stop-loss below the pattern's low to limit risk.
By learning the Piercing Line, you can better spot reversals. This pattern is a helpful tool for making smarter trading choices.
Bearish Candlestick Patterns Forex
Bearish candlestick patterns show when upward trends might reverse. These patterns suggest sellers are gaining control, helping with trading choices. Below are three important bearish candlestick patterns to understand.
Shooting Star
The Shooting Star shows up after an uptrend and hints at a reversal. It has a small body near the bottom and a long upper wick. This means buyers pushed prices up but lost strength as sellers took over. It often signals weaker buying power.
To confirm the Shooting Star:
- Look for a strong bearish candle after it.
- Check if it forms near resistance levels.
- Use tools like RSI or moving averages for extra proof.
A Shooting Star with high trading volume is more reliable. When paired with market analysis, it becomes a strong tool for spotting reversals.
Bearish Engulfing
The Bearish Engulfing pattern has two candles. The first is a small bullish candle, and the second is a big bearish candle that covers the first. This pattern shows sellers overpowering buyers, often leading to a price drop.
This pattern appears during an uptrend. It works better near resistance levels or after a long rally. Studies show it is more reliable when confirmed by tools like volume checks or support and resistance levels.
Evening Star
The Evening Star uses three candles to show a reversal. The first is a long bullish candle, the second is a small candle showing indecision, and the third is a long bearish candle. This pattern shows buyers losing control as sellers gain strength.
History shows the Evening Star works well. For example:
- During the 2008 financial crisis, it marked big downward moves.
- Tests on the NASDAQ 100 showed it often predicted drops after rallies.
To use the Evening Star, find it after an uptrend. Confirm it with tools like volume checks or technical indicators. This pattern is a trusted signal for spotting bearish reversals in forex trading.
Learning these bearish candlestick patterns can help you predict market changes and make smarter trading decisions.
Dark Cloud Cover
The Dark Cloud Cover is a well-known bearish candlestick pattern. It shows a possible change from an uptrend to a downtrend. This pattern has two candles. The first is a long bullish candle, showing strong buying power. The second is a bearish candle. It opens above the first candle's close but ends below its middle. This change means sellers are taking control, which may cause prices to drop.
To spot the Dark Cloud Cover, look for it after a steady uptrend. The second candle closing below the first candle's middle confirms the pattern. Traders often pair this with tools like resistance levels or volume checks to improve predictions.
Tip: Use the Dark Cloud Cover with tools like RSI. This can help confirm overbought conditions and make your trades more accurate.
This pattern gives useful clues about market mood. It shows buyers losing strength while sellers step in. By noticing this shift, you can prepare for reversals and adjust your trading plan.
Hanging Man
The Hanging Man is another important bearish candlestick pattern. It forms after an uptrend and hints at a possible reversal. This pattern has a small body near the top and a long lower shadow. It shows sellers pushed prices down, but buyers brought them back up. However, the recovery is often weak, suggesting the uptrend might end soon.
Thomas Bulkowski, a chart expert, found the Hanging Man works 86% of the time. This happens when it matches a support level breakout in a reversing bear market. This makes it a trusted tool for traders. The pattern also shows that buying power may be fading, increasing the chance of a price drop.
To use the Hanging Man well, confirm it with other tools. For example, check for high trading volume or nearby resistance levels. This helps avoid mistakes and make better choices.
By learning the Hanging Man, you can predict when an uptrend might end. This can help you improve your trading plan and reduce risks.
Continuation Candlestick Patterns
Continuation candlestick patterns show when a trend might keep going. These patterns give clues about market behaviour, helping you trade wisely. Below are three important continuation candlestick patterns to know.
Doji
The doji is a special candlestick pattern showing market uncertainty. It forms when opening and closing prices are almost the same. This creates a tiny or no body at all. It shows buyers and sellers are evenly matched, causing indecision.
- A doji often shows up during pauses in trends.
- It signals a balance between buyers and sellers, making it important.
- Traders use it to adjust plans based on market changes.
When you see a doji, check nearby candles and the trend. This helps you decide if it means a continuation or a reversal.
Spinning Top
The spinning top is another pattern showing indecision in the market. It has a small body with long shadows above and below. This means neither buyers nor sellers are in full control. It often appears in calm or sideways markets.
- A spinning top hints the trend might continue but could reverse.
- Look at the next candles to confirm its meaning.
Traders combine spinning tops with other tools to improve accuracy. This helps avoid mistakes and make smarter trading choices.
Three White Soldiers
The three white soldiers pattern is a strong sign of a bullish trend. It has three long bullish candles in a row, each closing higher than the last. This shows buyers are in charge, pushing prices up.
- The first candle shows the downtrend is ending.
- The next two candles confirm the upward strength.
Use the three white soldiers pattern to spot strong upward trends. Check volume or support levels to confirm its reliability. This pattern is great for finding bullish continuations in forex trading.
Three Black Crows
The Three Black Crows pattern shows a strong bearish trend. It has three long bearish candles, each closing lower than before. This pattern often appears after an uptrend, hinting at a reversal. Each candle opens within the previous one’s body, showing steady selling pressure.
This pattern signals a change in market mood. Buyers lose control as sellers take over, pushing prices down. It works better near resistance levels or after a long rally. Traders use it to confirm bearish trends and plan exits or short trades.
The Three Black Crows pattern is reliable because it shows strong selling. Each lower close strengthens the bearish signal, making it trusted for reversals. For example, spotting it after an uptrend suggests a downward move is coming. Using tools like moving averages or RSI can make it more accurate.
Tip: Don’t rely on the Three Black Crows alone. Always check with other indicators or volume to avoid mistakes.
By learning this pattern, you can predict bearish trends better. It helps you understand market changes and make smarter trading choices.
Master Candle
The Master Candle pattern shows market consolidation. It has one big candle followed by smaller ones staying within its range. This pattern often appears before a breakout, showing the market is preparing for a big move.
You can use the Master Candle to spot breakouts. When the price moves above or below the big candle’s range, it often starts a new trend. This makes it helpful for finding trading chances.
To trade well with the Master Candle, watch the breakout direction. A move above the range means a bullish trend. A move below means a bearish trend. Pairing it with support and resistance levels makes it more reliable.
Note: Wait for the breakout to confirm before trading. Acting too soon on false breakouts can cause losses.
By understanding the Master Candle, you can predict market moves better. It helps you spot consolidation phases and breakout points clearly.
How to Use Forex Candlestick Patterns Effectively
Mixing Candlestick Patterns with Other Tools
To trade better, mix candlestick patterns with other tools. This helps confirm signals and lowers the chance of mistakes. For example, using candlestick charts with moving averages shows support and resistance levels. The RSI tool checks if the market is overbought or oversold. Bollinger Bands can show how much the market is moving.
A study by TASA found that combining candlestick patterns with moving averages and momentum tools made trades 20-25% more accurate. This proves that using different tools together improves trading success.
By mixing candlestick patterns with these tools, you can make smarter choices and improve your results.
Understanding Market Trends and Context
Knowing the market context is key to reading candlestick patterns. Look at the overall trend—whether it’s going up, down, or sideways. Checking longer timeframes gives a clearer view of the market. Trading with the main trend makes candlestick patterns more reliable.
By studying trends and volume, you’ll understand candlestick patterns better. This ensures you use them in the right way.
Practising and Testing Strategies
Practising and testing are important for learning candlestick patterns. Practice helps you spot patterns faster and use them with confidence. Testing shows how well your strategies work in different markets.
For example, testing the Evening Star pattern on NASDAQ 100 showed it works well after bullish rallies. Adding tools like moving averages or RSI made it even better. This shows why testing and improving strategies is so important.
By practising and testing, you can sharpen your skills. This helps you create strategies that work well in different markets.
Candlestick patterns are key for spotting trends in forex trading. They show price changes and help predict reversals or continuations. But using only these patterns can cause mistakes. Adding other tools like moving averages or momentum indicators makes them more reliable. For example, a study by TASA found this mix boosts trade accuracy by 20-25%.
To master candlestick patterns, you need practice and patience. By improving your skills and using these tools together, you can make smarter trading choices.